


Introduction:
In today’s rapidly evolving tech landscape, deploying applications using Kubernetes has become a crucial aspect of modern software development. This guide provides a detailed walkthrough for setting up an end-to-end Kubernetes project, covering everything from infrastructure provisioning to application deployment and monitoring.
Prerequisites:
Before diving into the implementation, ensure you have the following in place:
Basic understanding of Kubernetes concepts.
Access to AWS or any other cloud provider for server instances.
A TMDB API key for accessing movie databases in your Netflix Clone application.
DockerHub account for pushing and pulling Docker images.
Gmail account for email notifications.
Jenkins, Kubernetes, Docker, and necessary plugins installed.
You will get the Jenkinsfile and Kubernetes Manifest files along with the Dockerfile. Feel free to modify it accordingly
Project GitHub Repo- https://github.com/AmanPathak-DevOps/Netflix-Clone-K8S-End-to-End-Project
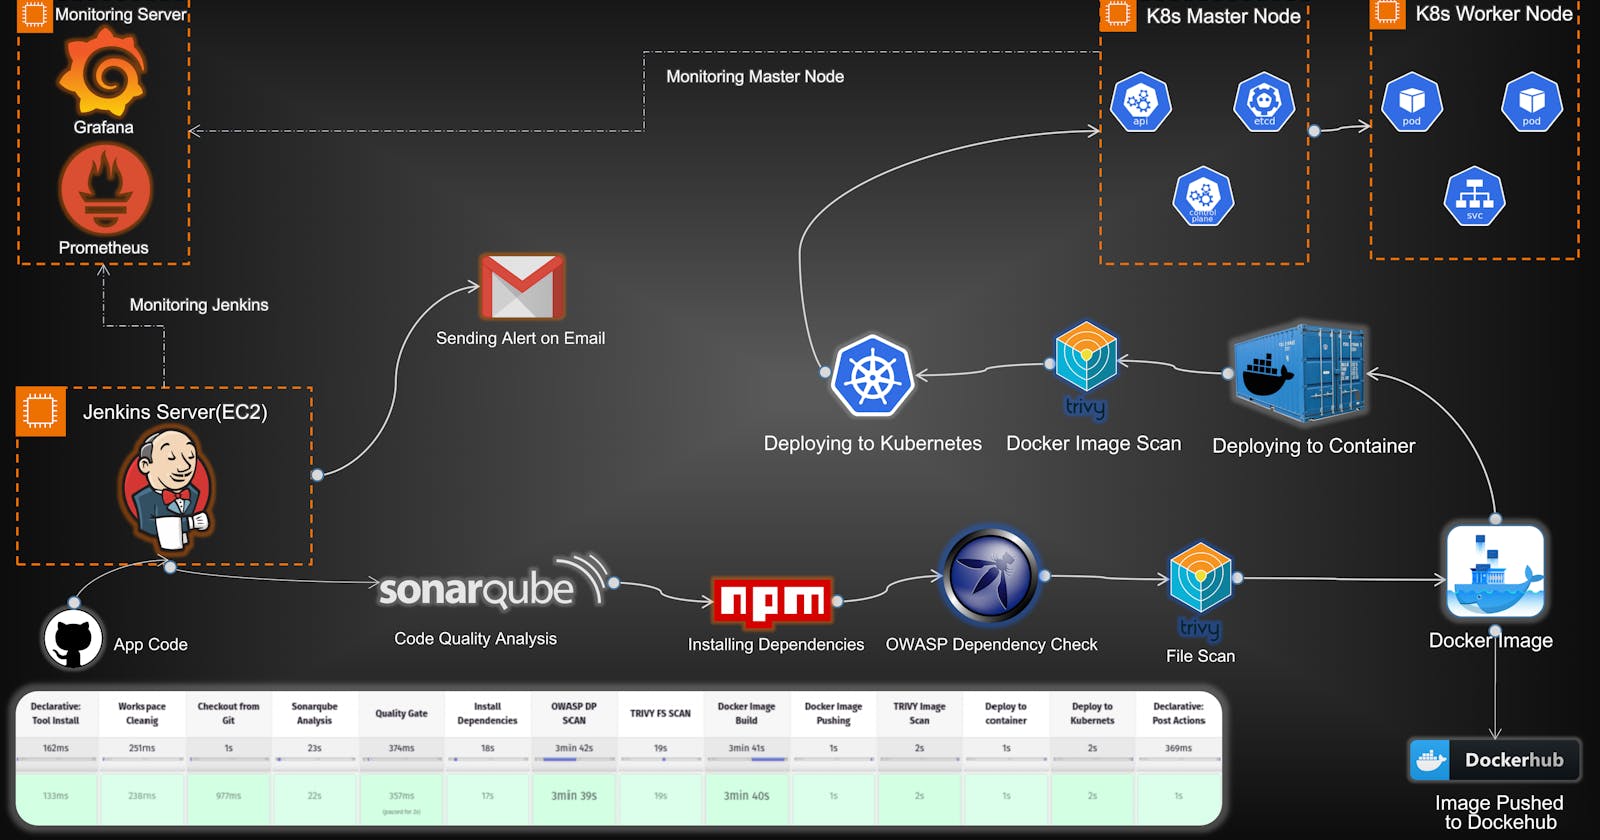
High-Level Overview:
Infrastructure Setup: Provisioned servers for Jenkins, Monitoring, and Kubernetes nodes.
Toolchain Integration: Integrated essential tools like Jenkins, SonarQube, Trivy, Prometheus, Grafana, and OWASP Dependency-Check.
Continuous Integration/Continuous Deployment (CI/CD): Automated workflows with Jenkins pipelines for code analysis, building Docker images, and deploying applications on Kubernetes.
Security Scanning: Implemented Trivy and OWASP Dependency-Check to scan for vulnerabilities in code and Docker images.
Monitoring and Visualization: Set up Prometheus and Grafana for real-time monitoring and visualization of both hardware and application metrics.
Email Notifications: Configured Jenkins for email alerts based on pipeline results.
We need four servers for our today’s Project
Jenkins Server- On this Server, Jenkins will be installed with some other tools such as Sonarqube (docker container), trivy, and kubectl.
Monitoring Server- This Server will be used for Monitoring where we will use Prometheus, Node Exporter, and Grafana.
Kubernetes Master Server- This Server will be used as the Kubernetes Master Cluster Node which will deploy the applications on worker nodes.
Kubernetes Worker Server- This Server will be used as the Kubernetes Worker Node on which the application will be deployed by the master node.
Let’s create the following instances.
Jenkins Server
Click on Launch Instances.

Provide the name of your Jenkins instance, and select the Ubuntu OS 22.04 version.

We need to configure multiple things on the Jenkins instance. So, select the t2.large instance type, provide the key or you can create if you want.
Keep the networking things as it is. But make sure to open all inbound and outbound traffic in the selected security groups.

Increase the storage capacity for Jenkins Instance from 8GB to 35GB and click on Launch Instance.

Monitoring Server
Provide the name of your Monitoring Instance, and select the Ubuntu 22.04 OS.

We need to configure the monitoring tools on this instance which needs a minimum of 4GB RAM. So, select the t2.medium instance type, provide the key or you can create if you want.
Keep the networking things as it is. But make sure to open all inbound and outbound traffic in the selected security groups.

Increase the storage capacity for Jenkins Instance from 8GB to 15GB and click on Launch Instance.

Kubernetes Master & Worker Node
We have to create two Kubernetes Nodes which need at least 2 CPUs.
Provide the name of your Kubernetes Master Instance, and select the Ubuntu 22.04 OS.
In the Number of Instances, replace 1 with 2 because we need two Kubernetes Nodes.

Select the t2.medium instance type, provide the key or you can create if you want.
Keep the networking things as it is. But make sure to open all inbound and outbound traffic in the selected security groups then keep the rest of the things as it is and click on Launch Instance.

Rename the Kubernetes Servers and all four servers will look like the below snippet.

Log in to the Jenkins Server

Download Open JDK and Jenkins
# Intsalling Java
sudo apt update -y
sudo apt install openjdk-11-jre -y
java --version

# Installing Jenkins
curl -fsSL https://pkg.jenkins.io/debian/jenkins.io-2023.key | sudo tee \
  /usr/share/keyrings/jenkins-keyring.asc > /dev/null
echo deb [signed-by=/usr/share/keyrings/jenkins-keyring.asc] \
  https://pkg.jenkins.io/debian binary/ | sudo tee \
  /etc/apt/sources.list.d/jenkins.list > /dev/null
sudo apt-get update -y
sudo apt-get install jenkins -y

Check the status of the Jenkins server

Copy your Jenkins Server Public IP and paste it into your favorite browser with port number 8080.

Run the command on your Jenkins server
sudo cat /var/lib/jenkins/secrets/initialAdminPassword
Copy the output and paste it into your above snippet text field and click on Continue.

Click on the Install suggested plugins

Click on the Skip and continue as admin

Click on Save and Finish

Install Docker and configure on the Jenkins Server
sudo apt update
sudo apt install docker.io -y
sudo usermod -aG docker jenkins
sudo usermod -aG docker ubuntu
sudo systemctl restart docker
sudo chmod 777 /var/run/docker.sock

Install Sonarqube on your Jenkins Server
We will use a docker container for Sonarqube
docker run -d --name sonar -p 9000:9000 sonarqube:lts-community

Now, copy your Public IP of Jenkins Server and add 9000 Port on your browser.
The username and password will be admin

Reset the password and click on Update

You will see your Sonarqube Server in the below snippet.

Install the Trivy tool on the Jenkins Server
sudo apt-get install wget apt-transport-https gnupg lsb-release
wget -qO - https://aquasecurity.github.io/trivy-repo/deb/public.key | sudo apt-key add -
echo deb https://aquasecurity.github.io/trivy-repo/deb $(lsb_release -sc) main | sudo tee -a /etc/apt/sources.list.d/trivy.list
sudo apt-get update
sudo apt-get install trivy

Install and Configure the Prometheus, Node Exporter, and Grafana on the Monitoring Server
Login to the Monitoring Server

Create Prometheus user
sudo useradd \
--system \
--no-create-home \
--shell /bin/false prometheus

Download the Prometheus file on the Monitoring Server
wget https://github.com/prometheus/prometheus/releases/download/v2.49.0-rc.1/prometheus-2.49.0-rc.1.linux-amd64.tar.gz

Untar the Prometheus download package
tar -xvf prometheus-2.49.0-rc.1.linux-amd64.tar.gz

Create two directories /data and /etc/prometheus to configure the Prometheus
sudo mkdir -p /data /etc/prometheus
Now, enter into the prometheus package file that you have untar in the earlier step.
cd prometheus-2.49.0-rc.1.linux-amd64/

Move the prometheus and promtool files package in /usr/local/bin
sudo mv prometheus promtool /usr/local/bin/

Move the console and console_libraries and prometheus.yml in the /etc/prometheus
sudo mv consoles console_libraries/ prometheus.yml /etc/prometheus/

Provide the permissions to prometheus user
sudo chown -R prometheus:prometheus /etc/prometheus/ /data/

Check and validate the Prometheus
prometheus --version

Create a systemd configuration file for Prometheus
Edit the file /etc/systemd/system/prometheus.service
sudo vim /etc/systemd/system/prometheus.service
and paste the below configurations in your prometheus.service configuration file and save it
[Unit]
Description=Node Exporter
Wants=network-online.target
After=network-online.target
StartLimitIntervalSec=500
StartLimitBurst=5
[Service]
User=node_exporter
Group=node_exporter
Type=simple
Restart=on-failure
RestartSec=5s
ExecStart=/usr/local/bin/node_exporter \
--collector.logind
[Install]
WantedBy=multi-user.target

Once you write the system configuration file for Prometheus, then enable it and start the Prometheus service.
sudo systemctl enable node_exporter
sudo systemctl enable node_exporter
systemctl status node_exporter.service

Once the Prometheus service is up and running then, copy the public IP of your Monitoring Server and paste it into your favorite browser with a 9090 port.

Now, we have to install a node exporter to visualize the machine or hardware level data such as CPU, RAM, etc on our Grafana dashboard.
To do that, we have to create a user for it.
sudo useradd \
    --system \
    --no-create-home \
    --shell /bin/false node_exporter

Download the node exporter package
wget https://github.com/prometheus/node_exporter/releases/download/v1.7.0/node_exporter-1.7.0.linux-amd64.tar.gz

Untar the node exporter package file and move node_exporter directory in the /usr/local/bin directory
tar -xvf node_exporter-1.7.0.linux-amd64.tar.gz
sudo mv node_exporter-1.7.0.linux-amd64/node_exporter /usr/local/bin/

Validate the version of node exporter
node_exporter --version

Create the systemd configuration file for node exporter.
Edit the file
sudo vim /etc/systemd/system/node_exporter.service
Copy the below configurations and paste in the /etc/systemd/system/node_exporter.service file.
[Unit]
Description=Node Exporter
Wants=network-online.target
After=network-online.target
StartLimitIntervalSec=500
StartLimitBurst=5
[Service]
User=node_exporter
Group=node_exporter
Type=simple
Restart=on-failure
RestartSec=5s
ExecStart=/usr/local/bin/node_exporter \
--collector.logind
[Install]
WantedBy=multi-user.target

Enable the node exporter systemd configuration file and start it.
sudo systemctl enable node_exporter
sudo systemctl enable node_exporter
systemctl status node_exporter.service
Now, we have to add a node exporter on our Prometheus target section. So, we will be able to monitor our server.
edit the file
sudo vim /etc/prometheus/prometheus.yml
Copy the content in the file
  - job_name: "node_exporter"
    static_configs:
       - targets: ["localhost:9100"]

After saving the file, validate the changes that you have made using promtool.
promtool check config /etc/prometheus/prometheus.yml

If your changes have been validated then, push the changes to the Prometheus server.
curl -X POST http://localhost:9090/-/reload

Now, go to your Prometheus server and this time, you will see one more target section as node_exporter which should be up and running.

Now, install the Grafana tool to visualize all the data that is coming with the help of Prometheus.
sudo apt-get install -y apt-transport-https software-properties-common wget
sudo mkdir -p /etc/apt/keyrings/
wget -q -O - https://apt.grafana.com/gpg.key | gpg --dearmor | sudo tee /etc/apt/keyrings/grafana.gpg > /dev/null
echo "deb [signed-by=/etc/apt/keyrings/grafana.gpg] https://apt.grafana.com stable main" | sudo tee -a /etc/apt/sources.list.d/grafana.list
echo "deb [signed-by=/etc/apt/keyrings/grafana.gpg] https://apt.grafana.com beta main" | sudo tee -a /etc/apt/sources.list.d/grafana.list
sudo apt-get update

Install the Grafana
sudo apt-get install grafana

Enable and start the Grafana Service
sudo systemctl enable node_exporter
sudo systemctl enable node_exporter
systemctl status node_exporter.service

To access the Grafana dashboard, copy the public IP address of the Monitoring Server and paste it into your favorite browser with port 3000
username and password will be admin

Reset the password

Click on Data sources

Select the Prometheus

Provide the Monitoring Server Public IP with port 9090 to monitor the Monitoring Server.

Click on Save and test.

Go to the dashboard section of Grafana and click on the Import dashboard.

Add 1860 for the node exporter dashboard and click on Load.

Then, select the Prometheus from the drop-down menu and click on Import

The dashboard will look like this

Now, we have to monitor our Jenkins Server as well.
For that, we need to install the Prometheus metric plugin on our Jenkins.
Go to Manage Jenkins -> Plugin search for Prometheus metrics install it and restart your Jenkins.

Edit the /etc/prometheus/prometheus.yml file
sudo vim /etc/prometheus/prometheus.yml
- job_name: "jenkins"
    static_configs:
      - targets: ["<jenkins-server-public-ip>:8080"]

Once you add the Jenkins job, validate the Prometheus config file whether it is correct or not by running the below command.
promtool check config /etc/prometheus/prometheus.yml
Now, push the new changes on the Prometheus server
curl -X POST http://localhost:9090/-/reload

Copy the public IP of your Monitoring Server and paste into your favorite browser with a 9090 port with /target. You will see the targets that you have added in the /etc/prometheus/prometheus.yml file.

To add the Jenkins Dashboard on your Grafana server.
Click on New -> Import.

Provide the 9964 to Load the dashboard.

Select the default Prometheus from the drop-down menu and click on Import.

You will see your Jenkins Monitoring dashboard like the below snippet.

Now, we have to integrate Email Alert. So, if our Jenkins pipeline will succeed or fail we will get a notification alert on our email.
To do that, we need to install the Jenkins Plugin, whose name is Email Extension Template.
Manage Jenkins -> Plugins and install the Email Extension Template plugin.

After installing the plugin, go to your email ID and click on Manage account and you will see what looks like the below snippet.

In the Security section, search for App passwords and click on it.

Gmail will prompt you for the password. Provide the password then you have to provide the name of your app where you are integrating email service.

You will get your password below. Copy the password and keep it secure somewhere.

Add your Gmail ID and the password that you have generated in the previous step.
Go to Manage Jenkins -> Credentials.
Click on (global).

Click on Add Credentials

Select the Username with password in Kind.
Provide your email ID and generated password then provide the ID as mail to call both credentials.

You can see we have added the credentials for the mail.

Now, we have to configure our mail for the alerts.
Go to Jenkins -> Manage Jenkins -> System
Search for Extend E-mail Notification.
Provide the smtp.gmail.com in the SMTP server and 465 in the SMTP port.

Then, On the same page Search for Extend E-mail Notification.
Provide the smtp.gmail.com in the SMTP server and 465 in the SMTP port.
Select the Use SMTP Authentication and provide the Gmail ID and its password in the Username and password.
To validate whether Jenkins can send the emails to you or not, check the Test configuration by sending a test e-mail.

You can see below for the reference.

Now, we will set up our Jenkins Pipeline. But there are some plugins required to work with them.
Download the following plugins
Eclipse Temurin installer
SonarQube Scanner
NodeJS

Now, configure the plugins
Go to Manage Jenkins -> Tools
Click on Add JDK and provide the following things below

Click on Add NodeJS and provide the following things below

Now, we will configure Sonarqube
To access the sonarqube, copy the Jenkins Server public IP with port number 9000
Then, click Security and click on Users.

Click on the highlighted blue box on the right to generate the token.

Now provide the name of your token and click on Generate.

Copy the generated token and keep it somewhere.

Now, add the token to your Jenkins credentials
Go to Manage Jenkins -> Credentials.
Select the Secret text in Kind.
Provide your token then provide the ID as sonar-token to call the credentials.

Go to Manage Jenkins -> System
Click on Add Sonarqube

Provide the name sonar-server with the Server URL and select the credentials that we have added.

Go to Manage Jenkins -> Tools
Find Sonarqube Scanner and click on Add

Provide the name sonar-server and select the latest version of Sonarqube.

To create a webhook, click on Configuration and select Webhooks.

Click on Create.

Provide the name and Jenkins URL like below and click on Create.

The Webhook will be showing the below snippet.

To create a project, click on Manually.

Provide the name of your project and click on Set up.

Select the existing token and click on continue.

Select the Other as your build and Linux as OS.

Now, we will create the Jenkins Pipeline
Click on Create item.

Provide the name of your Jenkins Pipeline and select Pipeline.

Currently, we are just creating a pipeline for Sonarqube analysis of the code, quality gate for Sonarqube, and installing the dependencies.
In the post-build, we have added email alerts for the success or failure of the pipeline.
pipeline{
    agent any
    tools{
        jdk 'jdk'
        nodejs 'nodejs'
    }
    environment {
        SCANNER_HOME=tool 'sonar-server'
    }
    stages {
        stage('Workspace Cleaning'){
            steps{
                cleanWs()
            }
        }
        stage('Checkout from Git'){
            steps{
                git branch: 'master', url: 'https://github.com/AmanPathak-DevOps/Netflix-Clone-K8S-End-to-End-Project.git'
            }
        }
        stage("Sonarqube Analysis"){
            steps{
                withSonarQubeEnv('sonar-server') {
                    sh ''' $SCANNER_HOME/bin/sonar-scanner -Dsonar.projectName=Netflix \
                    -Dsonar.projectKey=Netflix \
                    '''
                }
            }
        }
        stage("Quality Gate"){
           steps {
                script {
                    waitForQualityGate abortPipeline: false, credentialsId: 'sonar-token'
                }
            }
        }
        stage('Install Dependencies') {
            steps {
                sh "npm install"
            }
        }
    }
    post {
     always {
        emailext attachLog: true,
            subject: "'${currentBuild.result}'",
            body: "Project: ${env.JOB_NAME}<br/>" +
                "Build Number: ${env.BUILD_NUMBER}<br/>" +
                "URL: ${env.BUILD_URL}<br/>",
            to: 'aman07pathak@gmail.com',
            attachmentsPattern: 'trivyfs.txt,trivyimage.txt'
        }
    }
}

Click on build pipeline and after getting the success of the pipeline.
You will see the Sonarqube code quality analysis which will look like the below snippet.

Now, we have to add one more tool for our application named OWASP Dependency-check.
Go to Manage Jenkins -> Plugins
Search for OWASP Dependency-Check and install it.

After installing, make sure to configure the OWASP.
Provide the name select the latest version of OWASP and click on Save.

Now, add the OWASP dependency check stage in the Jenkins pipeline and click on Save.
stage('OWASP DP SCAN') {
            steps {
                dependencyCheck additionalArguments: '--scan ./ --disableYarnAudit --disableNodeAudit', odcInstallation: 'owasp-dp-check'
                dependencyCheckPublisher pattern: '**/dependency-check-report.xml'
            }
        }
stage('TRIVY FS SCAN') {
            steps {
                sh "trivy fs . > trivyfs.txt"
            }
        }

Now, click on Build Now.

Once your pipeline is successful. Then, scroll down and you will see a dependency check.
Click on it and you will see the output like the below snippet.

Now, we have to build our Docker Image and push it to DockerHub
To do that, we need to configure the following things.
Go to Manage Jenkins -> Credentials
Add Docker Credentials to your Jenkins

Add your credentials and click on Create.

Install the following Docker plugins on your Jenkins
Docker
Docker Commons
Docker Pipeline
Docker API
docker-build-step

Restart your Jenkins

Configure the tool in Jenkins
Go to Manage Jenkins -> Tools and provide the below details.

Our application is Netflix Clone. So we need some movie databases on our application.
For that, we have one application that will provide the API. So, we can use the API to get the movies on our application.
TMDB is one of them
Go to this link https://www.themoviedb.org/
Click on Join TMDB

Enter the details and click on SignUp

Once you sign up, you will get a confirmation email on your account. Confirm it.
Log in to your TMDB account and go to the settings.

Go to the API section.

Click on Create to generate API

Select Developer.

Accept the Terms & Conditions.

Provide the basic details and click on Submit.

After clicking on Submit. You will get your API. Copy the API and keep it somewhere.

Now, we have to configure our Docker images where we will build our image with the help of new code and then, push it to DockerHub.
After pushing the image, we will scan our DockerHub Image to find the vulnerabilities in the image.
Make sure to replace the API with your API and if you are pushing Dockerfile on your Dockerhub account then, replace my username of the Dockerhub with yours.
stage("Docker Image Build"){
            steps{
                script{
                   withDockerRegistry(credentialsId: 'docker', toolName: 'docker'){
                       sh "docker system prune -f"
                       sh "docker container prune -f"
                       sh "docker build --build-arg TMDB_V3_API_KEY=8b174e589e2f03f9fd8123907bd7800c -t netflix ."
                    }
                }
            }
        }
        stage("Docker Image Pushing"){
            steps{
                script{
                   withDockerRegistry(credentialsId: 'docker', toolName: 'docker'){
                       sh "docker tag netflix avian19/netflix:latest "
                       sh "docker push avian19/netflix:latest "
                    }
                }
            }
        }

Click on Build

As you can see Our Pipeline is successful.

Now, validate whether the docker image has been pushed to DockerHub or not.
Log in to your Dockerhub account.
As you can see in the below screenshot, Our Docker image is present on Docker Hub.

Now, we have to deploy our application using Kubernetes.
To do that, we need to install kubectl on the Jenkins server.
sudo apt update
sudo apt install curl
curl -LO https://dl.k8s.io/release/$(curl -L -s https://dl.k8s.io/release/stable.txt)/bin/linux/amd64/kubectl
sudo install -o root -g root -m 0755 kubectl /usr/local/bin/kubectl
kubectl version --client

As you know, we have two Kubernetes Nodes of which is Master and the other one the Worker Node.
Login to your both Kubernetes Master and Worker Nodes
Master Node

Worker Node

Add the hostname to your Kubernetes master node
sudo hostnamectl set-hostname K8s-Master

Add the hostname to your Kubernetes worker node
sudo hostnamectl set-hostname K8s-Worker

Run the below commands on the both Master and Worker Nodes.
sudo su
swapoff -a; sed -i '/swap/d' /etc/fstab
cat <<EOF | sudo tee /etc/modules-load.d/k8s.conf
overlay
br_netfilter
EOF
sudo modprobe overlay
sudo modprobe br_netfilter
# sysctl params required by setup, params persist across reboots
cat <<EOF | sudo tee /etc/sysctl.d/k8s.conf
net.bridge.bridge-nf-call-iptables  = 1
net.bridge.bridge-nf-call-ip6tables = 1
net.ipv4.ip_forward                 = 1
EOF
# Apply sysctl params without reboot
sudo sysctl --system
apt update
sudo apt-get install -y apt-transport-https ca-certificates curl
curl -fsSL https://packages.cloud.google.com/apt/doc/apt-key.gpg | sudo gpg --dearmor -o /etc/apt/keyrings/kubernetes-archive-keyring.gpg
echo "deb [signed-by=/etc/apt/keyrings/kubernetes-archive-keyring.gpg] https://apt.kubernetes.io/ kubernetes-xenial main" | sudo tee /etc/apt/sources.list.d/kubernetes.list
apt update
apt-get install -y kubelet kubeadm kubectl kubernetes-cni
apt install docker.io -y
sudo mkdir /etc/containerd
sudo sh -c "containerd config default > /etc/containerd/config.toml"
sudo sed -i 's/ SystemdCgroup = false/ SystemdCgroup = true/' /etc/containerd/config.toml
systemctl restart containerd.service
systemctl restart kubelet.service
systemctl enable kubelet.service
Now, run the following commands Only on the Master Node, and then you will get the command that is highlighted in the below snippet.
kubeadm config images pull
kubeadm init

Exit from the root user and run the below commands
mkdir -p $HOME/.kube
sudo cp -i /etc/kubernetes/admin.conf $HOME/.kube/config
sudo chown $(id -u):$(id -g) $HOME/.kube/config

Run on the Worker Node
Run the below command as a root user
kubeadm join 172.31.59.154:6443 --token deq9nl.y34go2ziii0fu8c1 \
--discovery-token-ca-cert-hash sha256:e93c56bd59b175b81845a671a82ffd1839e42272d922f9c43ca8d8f6d145ce02

Both nodes are not ready because the network plugin is not installed on the master node

Only on the Master Node
Run the below command to install the network plugin on the Master node
kubectl apply -f https://raw.githubusercontent.com/projectcalico/calico/v3.25.0/manifests/calico.yaml

Both nodes are ready.

Install the following Kubernetes Plugins on your Jenkins
Kubernetes
Kubernetes Credentials
Kubernetes Client API
Kubernetes CLI
Kubernetes Credential Provider


Now, we will set up the Monitoring for both Kubernetes Master and worker Nodes
Run the below command on both Kubernetes Nodes
sudo useradd \
    --system \
    --no-create-home \
    --shell /bin/false node_exporter

Download the node exporter package on both Kubernetes Nodes and Untar the node exporter package file and move the node_exporter directory to the /usr/local/bin directory.
wget https://github.com/prometheus/node_exporter/releases/download/v1.7.0/node_exporter-1.7.0.linux-amd64.tar.gz
tar -xvf node_exporter-1.7.0.linux-amd64.tar.gz
sudo mv node_exporter-1.7.0.linux-amd64/node_exporter /usr/local/bin/

Create the systemd configuration file for node exporter.
Edit the file
sudo vim /etc/systemd/system/node_exporter.service
Copy the below configurations and paste them into the /etc/systemd/system/node_exporter.service file.
[Unit]
Description=Node Exporter
Wants=network-online.target
After=network-online.target
StartLimitIntervalSec=500
StartLimitBurst=5
[Service]
User=node_exporter
Group=node_exporter
Type=simple
Restart=on-failure
RestartSec=5s
ExecStart=/usr/local/bin/node_exporter \
--collector.logind
[Install]
WantedBy=multi-user.target

Enable the node exporter systemd configuration file and start it.
sudo systemctl enable node_exporter
sudo systemctl enable node_exporter
systemctl status node_exporter.service

Now, we have to add a node exporter to our Prometheus target section. So, we will be able to monitor both Kubernetes Servers.
edit the file
sudo vim /etc/prometheus/prometheus.yml
Add both job names(Master & Worker nodes) with their respective public.

After saving the file, validate the changes that you have made using promtool.
promtool check config /etc/prometheus/prometheus.yml
If your changes have been validated then, push the changes to the Prometheus server.
curl -X POST http://localhost:9090/-/reload

As you know, Jenkins will deploy our application on the Kubernetes Cluster. To do that, Jenkins must have the access keys or something to connect with the master node.
To do that copy the content inside .kube/config on Kubernetes Master node.
cat .kube/config

Save the file with the .txt extension.

Now, add the Secret file in Jenkins Credentials.
Click on Add credentials.

Select the Secret file and provide the Secret file that you have saved earlier enter the ID k8s then click on Create.

Now, Add the deploy to the Kubernetes stage in your Jenkins pipeline.
stage('Deploy to Kubernetes'){
            steps{
                script{
                    dir('Kubernetes') {
                        withKubeConfig(caCertificate: '', clusterName: '', contextName: '', credentialsId: 'k8s', namespace: '', restrictKubeConfigAccess: false, serverUrl: '') {
                                sh 'kubectl apply -f deployment.yml'
                                sh 'kubectl apply -f service.yml'
                                sh 'kubectl get svc'
                                sh 'kubectl get all'
                        }
                    }
                }
            }
        }

Click on Build Now
You will see that our Application has been deployed successfully on Kubernetes.

You can validate whether your pods are running or not from your Kubernetes master node.

Also, you can check the Console logs for the earlier results.

We got the email that our pipeline was successful.

We get the trivyfs.txt file which contains the vulnerabilities.

Also, we got the vulnerabilities for our Docker Image.

Jenkins sent the console logs by email.
If you want to access your Netflix Clone Application**.**
Copy the Public IP of Worker Node and paste it on your favorite browser with port 32000 and see the magic.

Another Snippet of our Netflix Clone application.

Go to the Grafana Dashboard and select Node Exporter.
You will see the real-time hardware specs of your Kubernetes master node.

You will see the real-time hardware specs of your Kubernetes worker node.

Conclusion:
In conclusion, this guide has equipped you with the knowledge and steps needed to deploy a sophisticated application using Kubernetes. From setting up infrastructure on AWS to integrating monitoring with Grafana and Prometheus, and finally deploying a Netflix Clone application, you’ve covered a wide array of DevSecOps practices.
🚀 Culmination of Our Kubernetes Expedition! 🎉
This undertaking marked the grand finale, concluding our enriching #30DaysOfKubernetes Series on its 30th day.
We trust you garnered valuable insights throughout this journey. Whether you're a seasoned explorer or just joining, explore the comprehensive topics covered in our GitHub Repo.
A heartfelt note for the last day: Thank you for embarking on this Kubernetes adventure with us. May your tech odyssey continue with boundless discoveries! 🌐💻✨ #KubernetesFinale #TechJourney #LearningTogether #GitHubRepo
https://github.com/AmanPathak-DevOps/30DaysOfKubernetes
Want to Know About Challenge?
If you’re eager to learn more and join our challenge through the GitHub Repository, stay tuned for the upcoming posts. Follow for more exciting insights into the world of Kubernetes!
GitHub Repository: https://github.com/AmanPathak-DevOps/30DaysOfKubernetes
#Kubernetes #DaemonSet #StatefulSets #NetworkPolicy #Operators #ContainerOrchestration #DevOps #AKS #Azure #K8sLearning #EndtoEndProject #KubernetesProject
Stay connected on LinkedIn: LinkedIn Profile
Stay up-to-date with GitHub: GitHub Profile
Feel free to reach out to me, if you have any other queries.
Happy Learning